Presidents Are Just One Factor Influencing the Business Cycle
As election news continues to swirl around us, there has never been a better time to recall the old expression, “presidents get too much blame and too much credit.” This is most certainly true with respect to the economy and financial markets. To be sure, Presidents are certainly one of the factors that can have influence on the business cycle, largely through fiscal policy changes they propose, and are able to get Congress to enact. The 2017 tax cuts and the Affordable Care Act being two of the more recent examples. Monetary policy, controlled by the Federal Reserve, has far more impact. Both directly and with almost immediate impact than the fiscal changes that Presidents can make, though this may be somewhat less true for the next few years. In addition, there are unpredictable external factors that can have a strong effect as well. The current pandemic is a prime example.
History and the Data Conflict With Popular Wisdom
Clearly, as the data will show, making broad investment decisions based on whether Democrats or Republicans are in power in Washington is not a sound basis for making changes to an investment portfolio. That is not to say that the specific policies of an administration/party should not warrant the attention of investors. Changes to corporate and/or capital gains taxes will impact financial markets, just as particular policies can create negative or positive impacts for specific industries and sectors, whether it’s price controls on products, trade tariffs, tax cuts, or tax hikes. Generally, these tend to be shorter-term trades that have all of the commensurate timing risks.
What Does the Data Say?
To show this more clearly, I did a study of stock market performance starting with the 1928 election of Herbert Hoover all the way through Donald Trump. Instead of looking solely at which political party held the White House, I also included which party held the majority in both the House of Representatives and the Senate.
Table 1 below displays the stock market return, since Herbert Hoover, for each two-year period because congressional elections occur every two years. Performance for each two-year period is measured from the beginning of October, roughly one month before election day. This is because markets anticipate changes before they occur. With a few notable exceptions (including 2016), markets correctly anticipate election results based on polls. So, performance for each two-year period was measured beginning roughly four weeks before each election day.
Table 1: Stock Market Performance and Political Party Control by Presidential and Congressional Terms
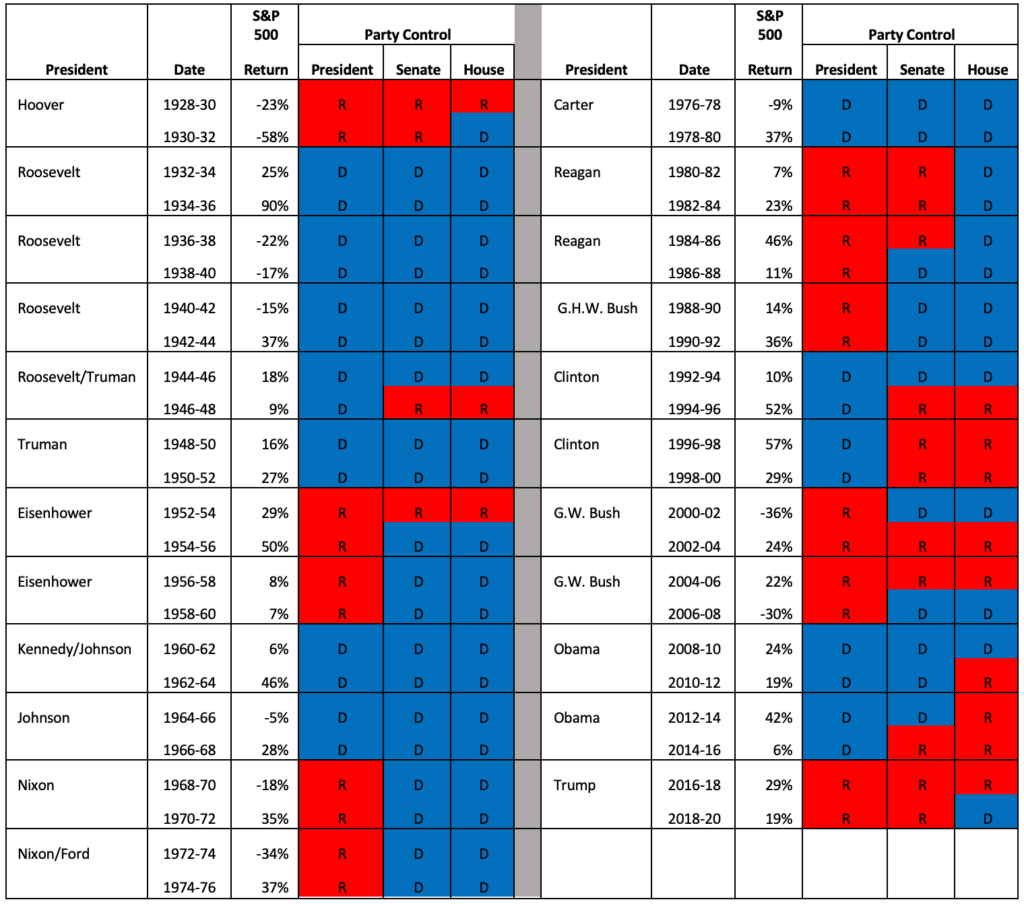
Source: Yahoo Finance for index price data (https://finance.yahoo.com/quote/%5ESP500TR/history/). The following websites for political party control (https://en.wikipedia.org/wiki/Divided_government_in_the_United_States and https://cstl-cla.semo.edu/rdrenka/ui320-75/presandcongress.asp). Bernstein Financial Advisory for all calculations and analysis.
Political Control in Washington Doesn’t Explain Stock Market Performance.
Just perusing the table, it becomes fairly apparent that there is little correlation between stock market performance and which political party was in power. To confirm this, I ran a regression analysis* of stock market performance against the party in power over the entire time period shown above, 1928-2020. It turns out that political party control explains about 2% of stock market performance. Another way to state this is that 98% of stock market performance is explained by factors other than which political party is governing.
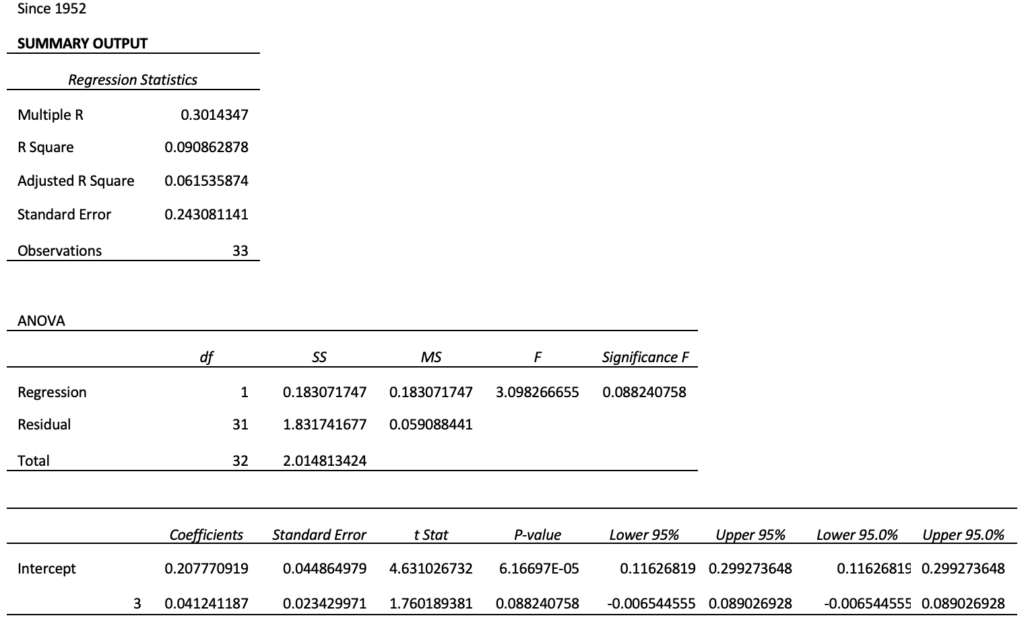
There is an argument to be made that the Depression and subsequent recovery could skew the results in a study such as this. To address this possibility, I also ran the same regression analysis beginning with the election of Dwight Eisenhower in 1952. The results were largely the same – political party power explained 9% of stock market performance over that period of time. Again, stated another way, this mean 91% of the stock market’s performance is explained by other factors.
*Regression analysis is a statistical tool that, among other things, can be used to analyze how much of the variance in a dependent variable (in this case stock market performance) can be explained by an independent variable (political party control). Stated plainly, how much of the stock market’s performance is explained by political party control.
Conclusion
Shifts in political control of the government can certainly present shorter-term investment opportunities in the stock market. However, as the analysis above shows, staying invested with a diversified portfolio will likely do well over a longer time horizon, and political shifts in Washington have virtually no effect on overall portfolio performance.
Appendix: Methodology
I converted Democratic or Republican control to a numeric scale. If the Presidency, House of Representatives, and Senate were all held by the Republicans that was assigned 4 points, if the Republicans held two of the three that was assigned a ½ point. The same was done for Democratic control, but with a negative sign, so that it would have an equal but opposite relationship. I gave a much heavier weighting to control of the Presidency and both Houses of Congress because it is generally much easier to move a legislative agenda when one party controls all three versus controlling two out of three.
I ran the regression analysis with stock market performance as the dependent variable and political control as the independent variable, as described above, to determine how much of the stock market’s performance is explained by political party control. All data sources used are cited in the footer of Table 1. Finally, the summary regression statistics are provided below for the full period since 1928, and for the period since 1952, for anyone who may be interested. These are the statistics generated by Microsoft Excel.

[…] compiled by John Bernstein, founder of Bernstein Financial Advisory, which measured stock market performance in two-year election cycles dating back to 1928 found that the political party in power was responsible for about 2% of the […]